


Patent-Pending “Profit Line”:
Tracking “Hidden” Piles of Money
Hi. I am the newest member of Banyan Hill Publishing’s elite staff of financial experts. And I’ve been asked not to reveal my name until the Profit Line Summit, airing on Tuesday, October 22 at 1 p.m. EDT.
In his last article, my colleague Jeff Yastine told you about how I have worked at the top of several multimillion-dollar companies, about my credentials as a forensic accountant working with multiple billionaires and about my long experience as a professional investor.
Today, I would like to give you a little more insight into how our proprietary “buy” indicator — the profit line — has been able to pinpoint many of the largest gains in the market in back tests that span almost two decades.
If you’ve been paying attention over the past few days, you’ve seen some of the numbers:
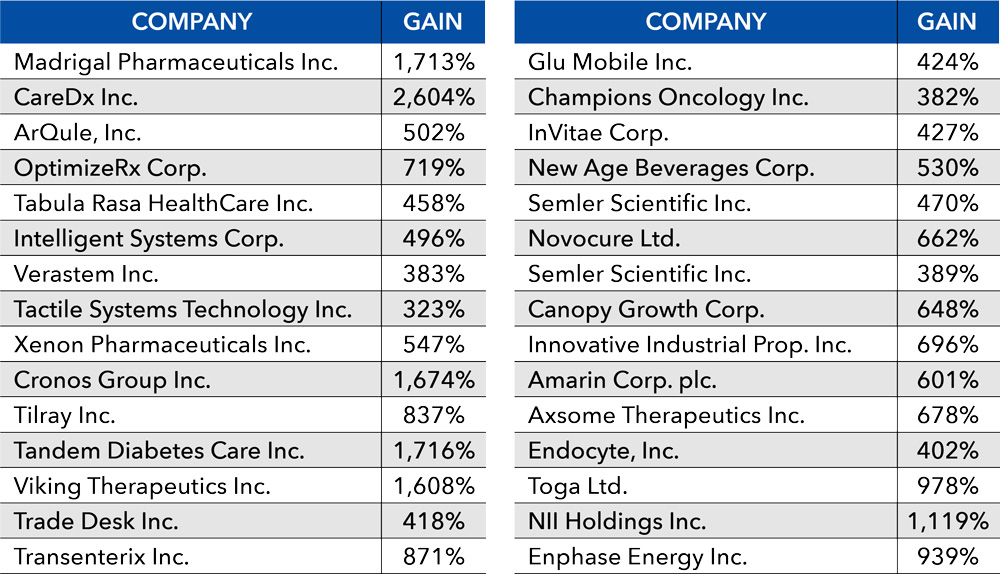
An extraordinary 24,267% cumulative gains that could have been had over the past 12 months is shocking … I know.
As a forensic accountant, I don’t take that number lightly — since I am conservative by nature.
But my experience was crucial to the discovery of this remarkable market-timing algorithm.
Why? Not All of the Money Is Accounted
for in Popular Financial Statements
You see, nearly every company has piles of money that can remain somewhat hidden from even the most persistent researchers and investors.
That’s in large part due to modern accounting practices.
It’s because of modern accounting practices that these hidden piles of money exist. And they are the reason why the profit line can be so potentially profitable.
That’s because not all of the money at a company is on the balance sheet, the cash flow statement or the income statement.
Even though it is required to be disclosed to the public, the hidden piles of money that the profit line tracks are not required on those statements most often reviewed by diligent investors.
Instead, this money is disclosed on an obscure government form that is filed with the Securities and Exchange Commission (SEC).
Anyone can go to the SEC and search out this information.
But it’s extremely difficult to aggregate the data.
You can typically only get it for ONE company at a time and only covering a few days at a time.
Trying to compile six-months’ worth of this data on a rolling day-by-day basis — the way our profit line algorithm does — could take the average investor weeks, just to look at one company.
Then, to parce this information out for the nearly 4,000 or so companies trading on the U.S. stock market would be almost impossible.
The beauty of this profit line is that it does most of the hard work for us.
Each day, it looks at all of the stocks on the market. It is able to pull extensive amounts of data from the SEC itself. And it can identify stocks where high levels of this hidden money have accumulated over the prior six months.
The biggest accumulations are represented by this profit line.
That’s what makes it show up in our charts. (Which you’ll see revealed for the first time ever at the summit.)
And that’s our signal to buy.
We’ve shown you a lot of huge back tested gains that could have been made if you had been able to follow the profit line in the past.
But what you’re going to see, at Jeff Yastine’s Profit Line Summit, is the weakness in Wall Street’s algorithms that the profit line is able to take advantage of.
The profit line shows up right in the middle of a pattern of events that we are seeing repeated over and over and over.
And, from our analysis, it’s telling us that if you choose to invest when you see the profit line in a company’s price chart, it could lead to huge moneymaking opportunities like the ones you see in the chart above.
I’m looking forward to sharing this remarkable and obvious pattern of events with you.
It’s the most important aspect to our patent pending profit line. So, you’re not going to want to miss it.
Sincerely
The Forensic Accountant